Understanding the Square Root Curve Grading Method
The square root curve is a grading system designed to lessen the impact of low scores on a student's final grade. Unlike linear scaling, it provides a disproportionately larger boost to lower scores, potentially creating a fairer grade distribution. This method, while seemingly simple, presents both advantages and disadvantages that warrant careful consideration. Let's explore its mechanics and implications.
How the Square Root Curve Works
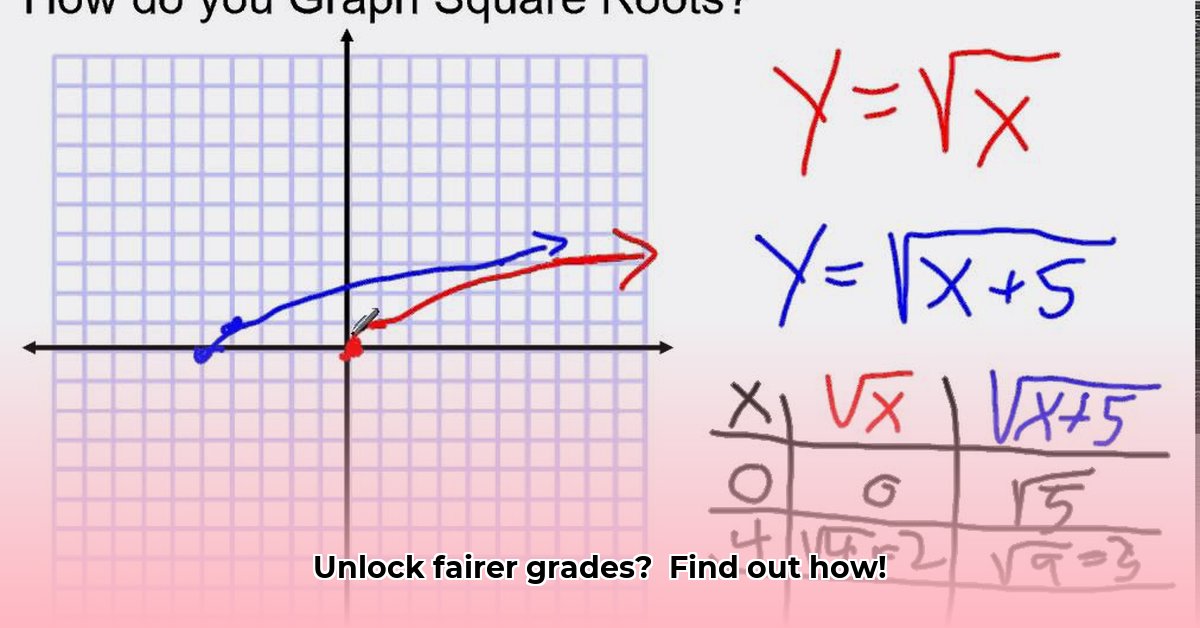
The core of this method lies in a straightforward formula: Adjusted Grade = √(Original Grade) * 10, where "Original Grade" is the student's raw percentage score. This formula applies a square root transformation to the original score, effectively compressing the higher end of the grade distribution while expanding the lower end. For instance, a student scoring 25% receives a 50% adjusted grade (√25 * 10 = 50), while a student scoring 75% receives an 86.6% adjusted grade (√75 * 10 ≈ 86.6). This non-linear impact (a mathematical transformation that doesn't change proportionally across the scale) is the defining characteristic of the square root curve. Online calculators can simplify the calculation process.
Advantages of the Square Root Curve
- Increased Fairness for Struggling Students: The significant boost to lower scores can positively impact students who struggle academically, potentially improving their confidence and motivation. This is the system's primary selling point.
- Smoother Grade Distribution: The curve can result in a more "normal" grade distribution, making it easier to compare student performance within a class or across different groups.
- Ease of Calculation and Implementation: The formula is simple, requiring minimal mathematical expertise. Readily available online calculators further streamline the process.
Disadvantages of the Square Root Curve
- Potential for Misinterpretation: The non-linear adjustment can lead to confusion. A 50% adjusted grade doesn't directly equate to 50% of the material mastered. This ambiguity can cause misunderstandings among students, parents, and educators.
- Questionable Equity: While intended to promote fairness, the square root curve might not achieve true equity. It might disproportionately benefit certain students while potentially downplaying the achievements of high-performing students.
- Limited Empirical Evidence: The long-term effects of this grading system on student learning and motivation lack comprehensive research. Further studies are needed to fully understand its impact.
A Step-by-Step Guide to Implementing the Square Root Curve
Implementing the square root curve requires careful planning and transparent communication. Here's a step-by-step guide:
- Obtain Original Scores: Collect students' raw percentage scores on the assessment.
- Apply the Formula: For each score, use the formula:
Adjusted Grade = √(Original Grade) * 10. - Round the Adjusted Grades: Round the results to the nearest whole number or tenth, depending on your preference.
- Communicate Clearly: Explain the method clearly to students, parents, and colleagues. Provide examples illustrating the transformation to avoid misunderstandings. Showing a graph comparing original and adjusted scores helps in visualizing the impact.
Mitigating Inequities and Enhancing Transparency
While the square root curve aims for fairness, its implementation requires careful consideration to mitigate potential biases:
- Transparency: Clearly communicate the grading method to students before the assessment. Explain the formula and show examples of its application across a range of scores.
- Contextual Analysis: Analyze the initial grade distribution. The curve might be less beneficial if the initial distribution is already relatively even.
- Comparative Analysis: Compare results obtained using the square root curve with those from other grading methods. This comparative analysis aids in informed decision-making.
- Holistic Assessment: Don't rely solely on numbers. Consider qualitative factors like class participation and effort when evaluating student performance.
- Iterative Improvement: Regularly review and adjust your grading practices based on feedback and observations.
Conclusion: The Square Root Curve: A Tool Requiring Careful Consideration
The square root curve offers a simple method for potentially improving grade equity, but its non-linear nature and limited research require cautious implementation. Transparency, careful communication, and a holistic assessment approach are crucial to maximize its potential while minimizing its drawbacks. It's a valuable tool, but not a panacea for grading challenges – effective use requires nuanced strategies and open communication.